
Know which site is exposed before the next audit.
Spot your exposed sites before the next audit cycle finds them.
- 0-100
- Risk score per location
- Normalised
- Sites comparable against each other
- Suggested actions
- Drawn from similar past findings
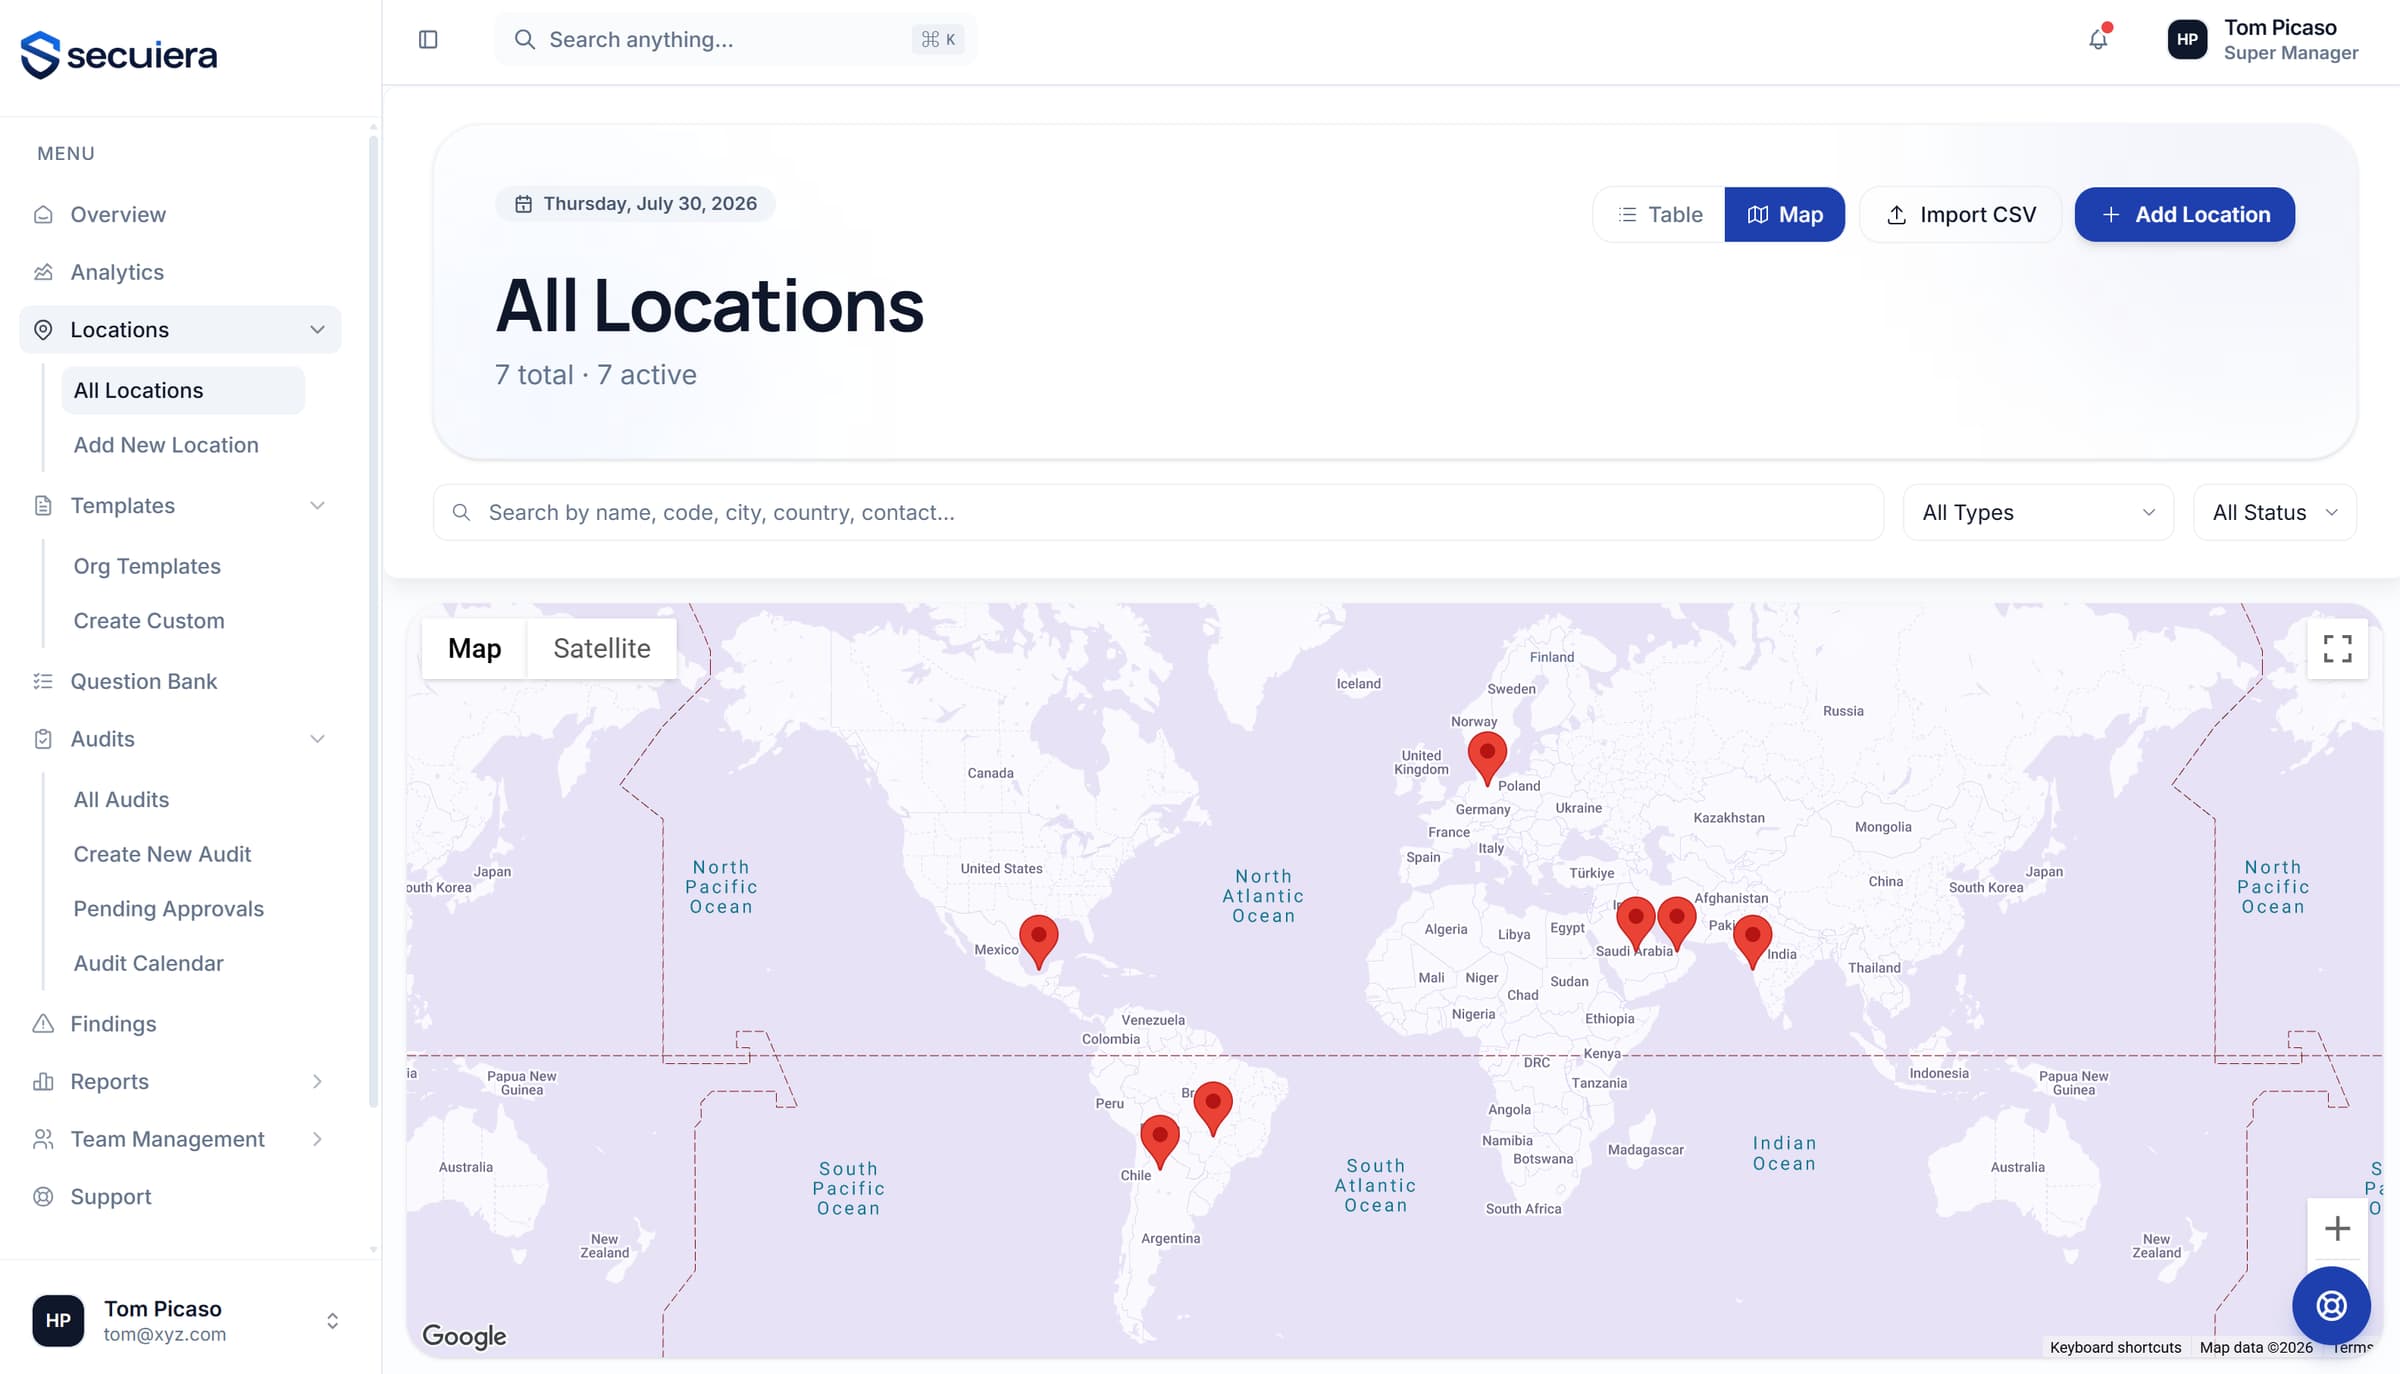
Your estate, with risk context
Every site scored on what the audits found and on conditions in the surrounding area. A site in a high-crime district with a weak perimeter score reads differently from the same score somewhere quiet.
- 1Risk score from 0 to 100 per site
- 2Audit history combined with area crime data for context
- 3Normalised, so one site's score means the same as another's
- 4Table view when you want to sort and compare rather than browse
Three things, described plainly.
A scoring layer over your audit data. It surfaces what is worth a look and leaves the decision to you.
Location risk scoring
Each site gets a normalised 0-100 score built from its audit results and the risk profile of the area around it. Comparable across sites, which a raw compliance percentage isn't.
Corrective action suggestions
When a finding resembles ones you've closed before, the platform surfaces what was done then, with a confidence score. A starting point, not an instruction.
Similar-action lookup
Search your corrective action history for comparable cases, so a problem someone already solved at another site doesn't get solved from scratch.
These run as a separate service alongside the platform. Scores appear against locations once there's enough audit history at a site to say anything meaningful about it.
The full list.
- Location risk scores combining audit history with area crime data
- Scores normalised 0-100, so sites compare against each other
- Suggested corrective actions drawn from similar past findings
- Similar-action lookup so you don't re-solve a solved problem
See it against your own sites
Thirty minutes with the people who build it, walked through the modules that matter to your programme rather than a scripted tour.