
Plants that were never consistent, scored consistently.
Production sites, R&D facilities, data halls and corporate offices. Each has its own history, its own local practice and its own idea of what 'secure' means. Audit them against one weighted control set and the numbers become comparable, which is what lets you decide where the budget goes.
- Plants & R&D sites
- Including corporate estates
- One weighted standard
- So scores are comparable
- Per-site breakdown
- Perimeter problem or paperwork
Not just the fence line, the people too.
The question bank covers insider risk and personnel security alongside physical controls, which is usually where a manufacturing programme has the least visibility.
100+
Controls to draw from
Across 16 sections
3
Criticality levels
Critical failures reported apart from the score
3
Roles
Site auditor through to organisation admin
100
Weights must sum to
Validated, so a template can't produce a meaningless score
Insider risk and personnel
Background screening coverage, training, access on joining and revocation on leaving. Controls with mandatory documentary evidence, because a verbal assurance about screening isn't an assurance.
Physical and perimeter
Site boundary, entry points, segregation of high-value or sensitive areas, surveillance coverage and monitoring, assessed on site rather than from a policy document.
Where IT meets the plant floor
Controls covering the boundary between operational technology and corporate IT: The physical security of the systems that run production. This is not a full cyber assessment.
Emergency procedures and records
Incident procedures, drills and record keeping. This is the section that tends to look fine until somebody asks for the evidence.
Which plant actually needs the money
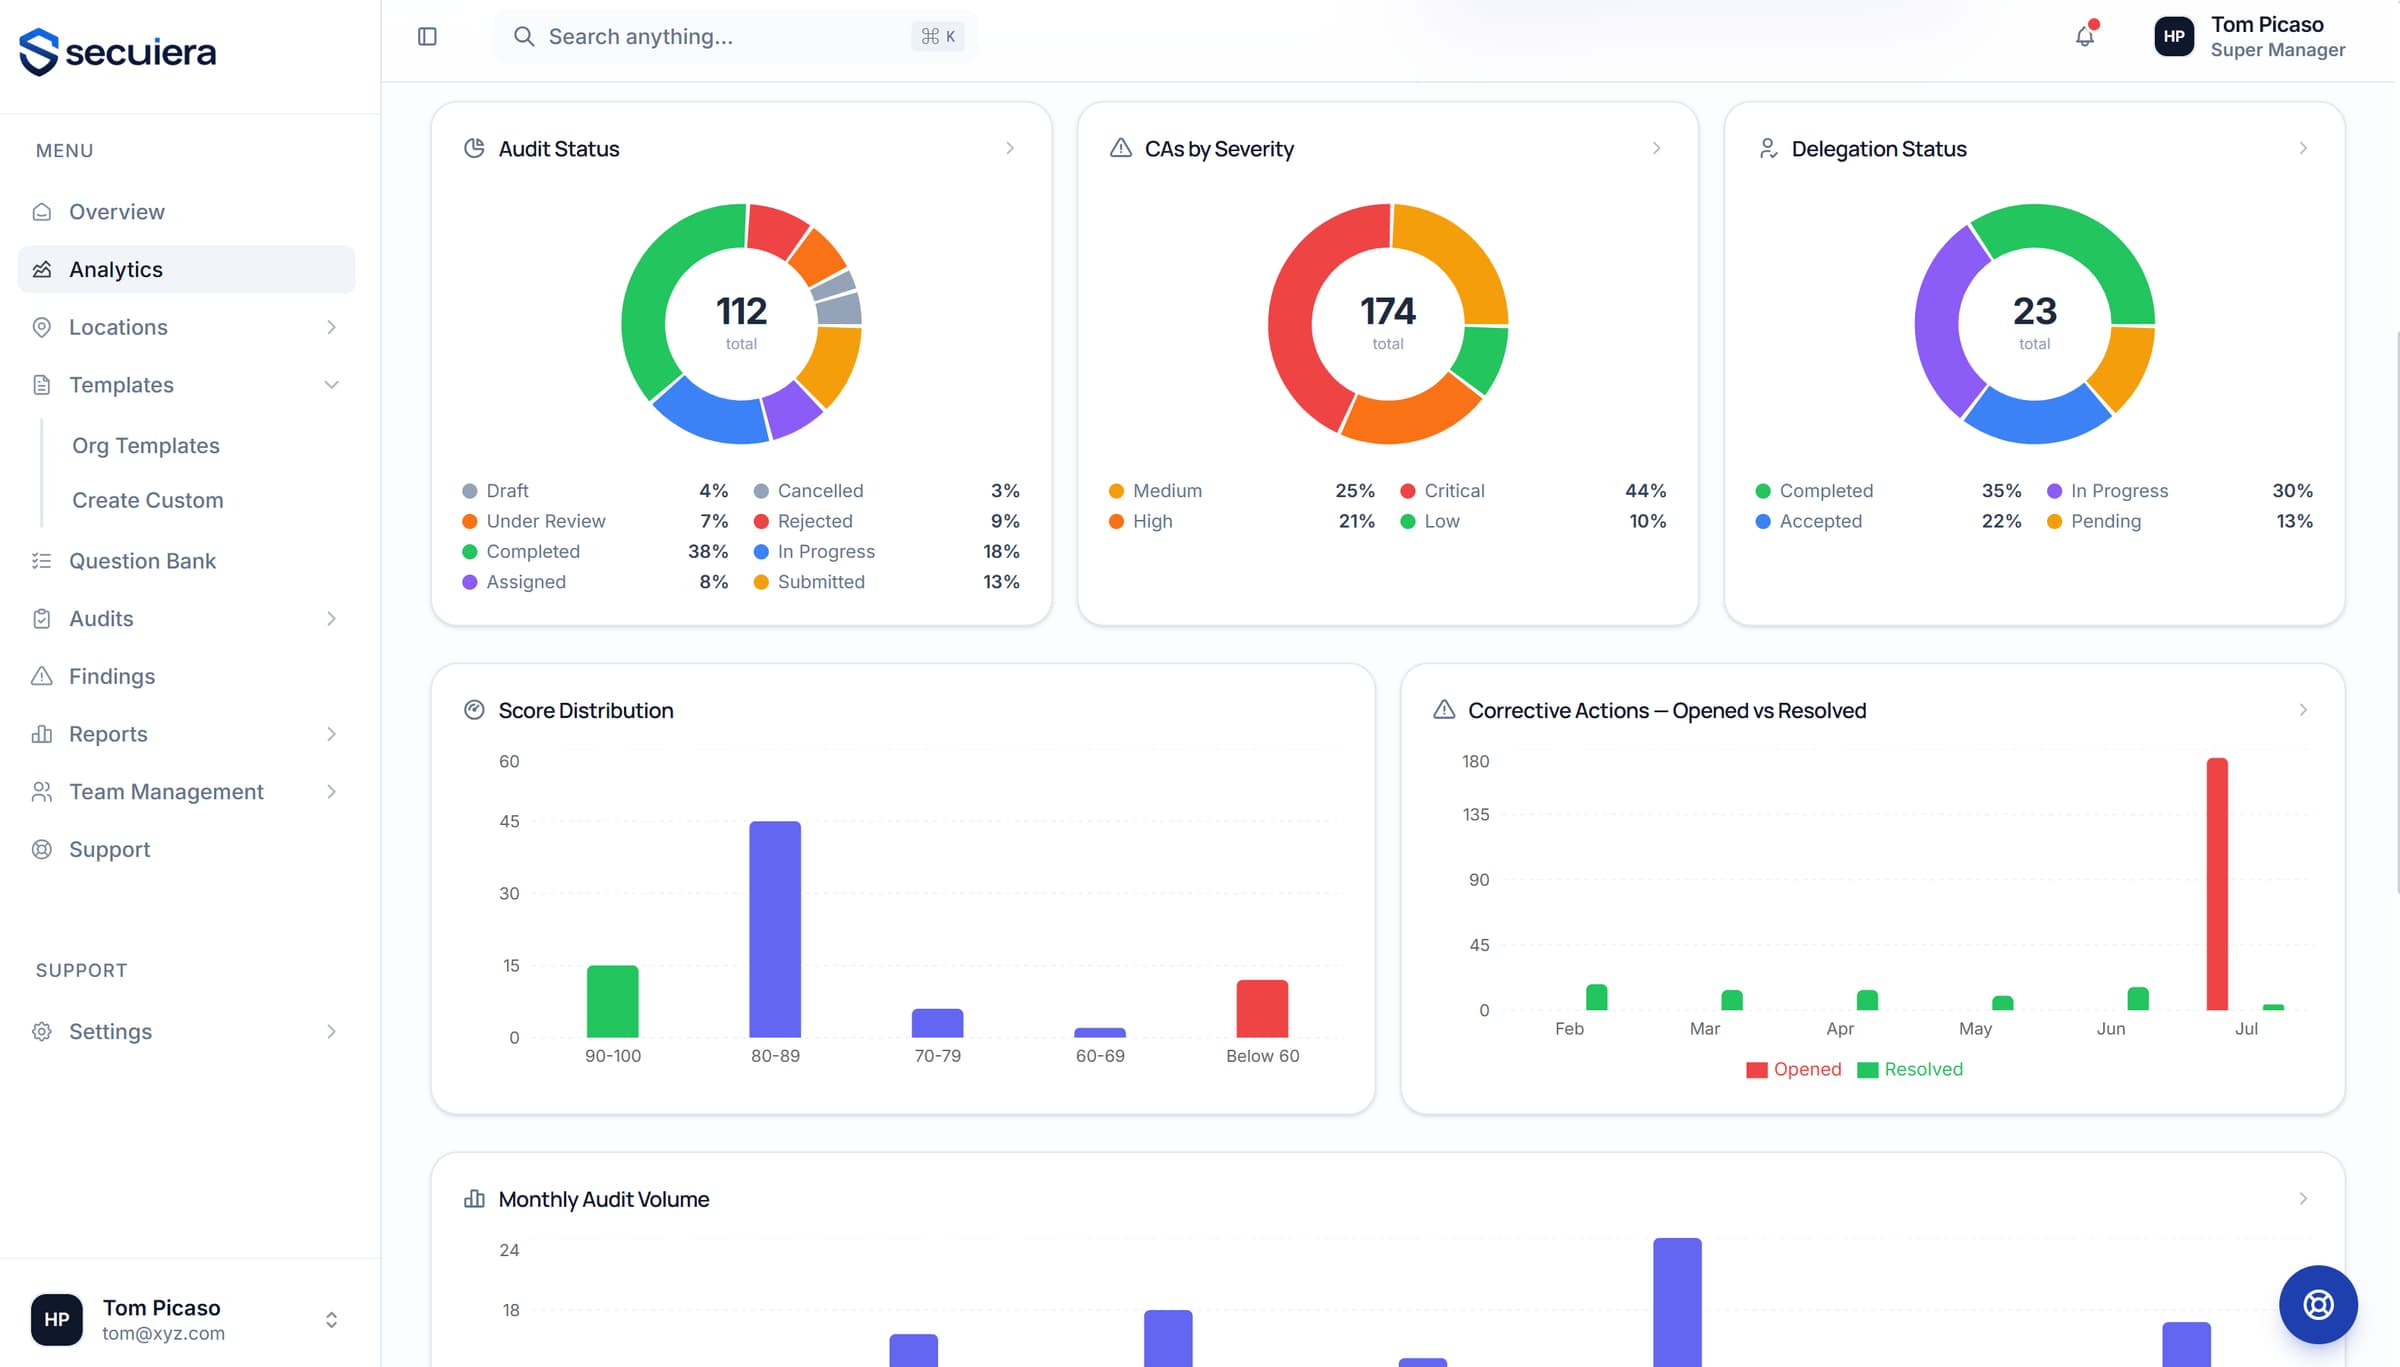
One weighted standard across every site means the scores can be compared. Section-level breakdown shows whether a low score is a perimeter problem or a paperwork problem. Those are very different budget conversations.
- 1Compliance score trend across your chosen window
- 2Per-site comparison on the same control set
- 3Section breakdown, so you can see where the score comes from
- 4Benchmark against the platform average across organisations
Bring us two plants that disagree
The most useful demo is a real disagreement: two sites you suspect are assessed inconsistently. We'll show you what running both against one weighted template looks like.